Led the end-to-end design initiative for new mobile app feature. Collaborated with user research to identify key opportunities for data capture and process standardization across 20 distribution centers
END-TO-END DESIGN
FEATURE PRIORITIZATION
WIREFRAMING & PROTOTYPING
MOBILE APPLICATION


PRODUCT OVERVIEW
What is a Freshness Walk?
A Freshness Walk is a quality check performed after produce arrives at a warehouse and before it is sent to stores. Quality Assurance teams inspect produce by sight and touch, much like shoppers do at the grocery store, to identify at-risk products and take action before they become waste or reach customers.
THE OPPORTUNITY
As part of the CEO’s company-wide freshness initiative, our team was tasked with creating a digital experience to improve Freshness Walks, helping distribution centers reduce waste and deliver fresher produce to customers.
THE OUTCOME
A streamlined DQA App (existing quality assurance app) enhancement that standardized the freshness walk across DCs to capture freshness walk data in-take and outputs providing trustworthy data visibility to at-risk product in the DC.
Project Scoping — Aligning on the True Problem
This project was part of the new Kroger CEO’s broader initiative to deliver fresher, more affordable produce. With high visibility, strategic importance, and a tight timeline, improving the Freshness Walk process was a key priority.
Leadership was ready to move quickly, but before jumping into solutions, I recognized that we hadn’t aligned on the problem we were actually trying to solve.
I interviewed 3 QA Inspector Supervisors and 2 business partners to understand the process from both operational and leadership perspectives. I synthesized patterns across their experiences to move beyond individual requests and identify the core opportunity: giving QA inspectors the tools and information to consistently identify at-risk produce and communicate what happens next.
I translated these findings into a focused How Might We statement to align the team and leadership around the problem.
SURVEY
Finding the Common Threads in 20 Different Freshness Walks
Kroger has 20 perishable distribution centers (DCs), and no two operate exactly alike, from unions and physical layouts to workflows and tools. While conversations with leadership revealed several high-level similarities, I knew the success of the solution would depend on understanding the site-specific details we’d need to account for.
Research at a glance
Reported that their biggest challenge was human error in inventory or code date entry
8%
Variance in sites that reported using the aged inventory report vs expiration report
33%
Reported that buyer responsiveness is a key to improving the overall Freshness Walk process
Key Findings
Buyer responsiveness varied
QA teams often struggled to get a response after sending their findings to Buyers. They had no visibility to if any action had been taken to move produce post Freshness Walk.
Inspection methods
Visual inspections were consistent across sites, but some DCs also conducted more involved Brix and PSI tests that required cutting product open on the floor.
Reporting usage varied
Some DCs relied on both Aged Inventory and Expiration Reports, while others used only Aged Inventory.
ON-SITE DISTRIBUTION CENTER VISITS
From Paper Notes to Inventory Gaps: Uncovering the Reality of Freshness Walks
Freshness Walks are highly physical, hands-on workflows. Inspectors move between their offices and the warehouse floor, physically inspecting produce, using different tools, and returning to their desks to document findings and complete the process. They also balance Freshness Walks with their primary responsibility: conducting initial inspections when produce arrives at the DC.
To understand the realities of the workflow beyond what could be captured in interviews, I partnered with User Research to develop an on-site research plan focused on observing inspectors in their actual environment.
RESEARCH GOALS
Understand how Freshness Walks are performed across DCs, including digital and physical workflows.
Identify pain points, inconsistencies, and opportunities to improve the process.
Assess available data and identify gaps that limit visibility into at-risk produce.
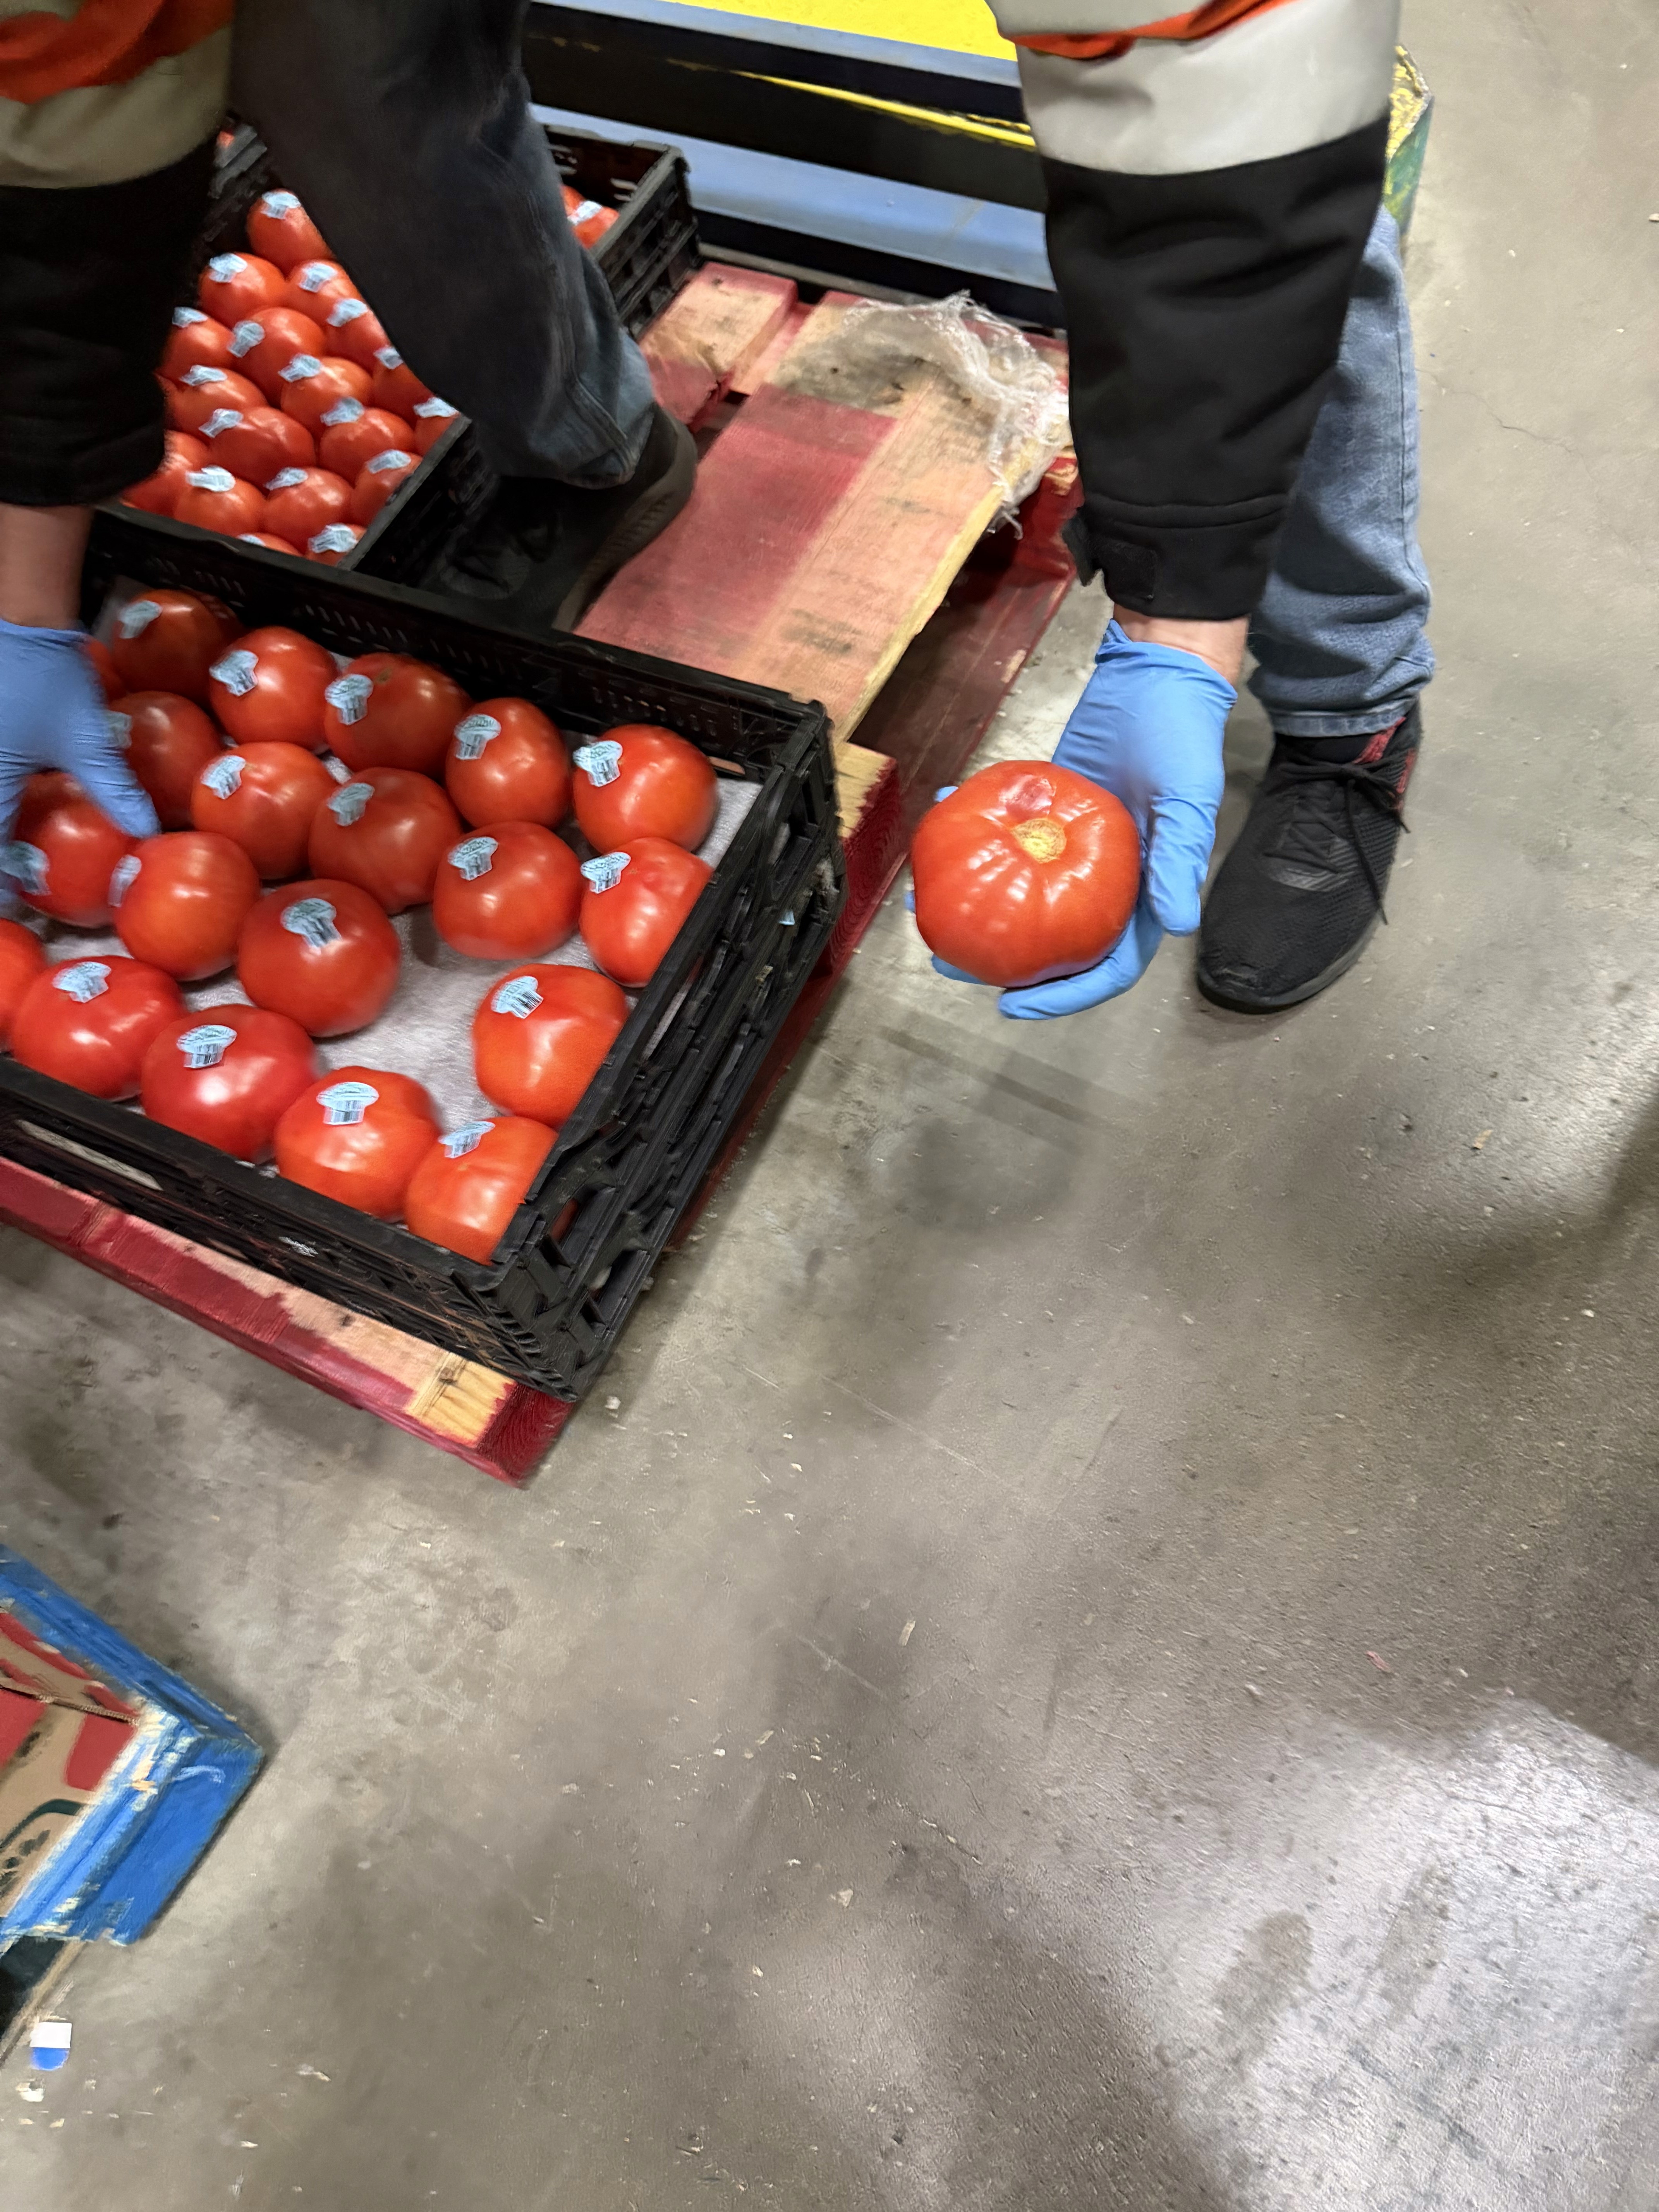
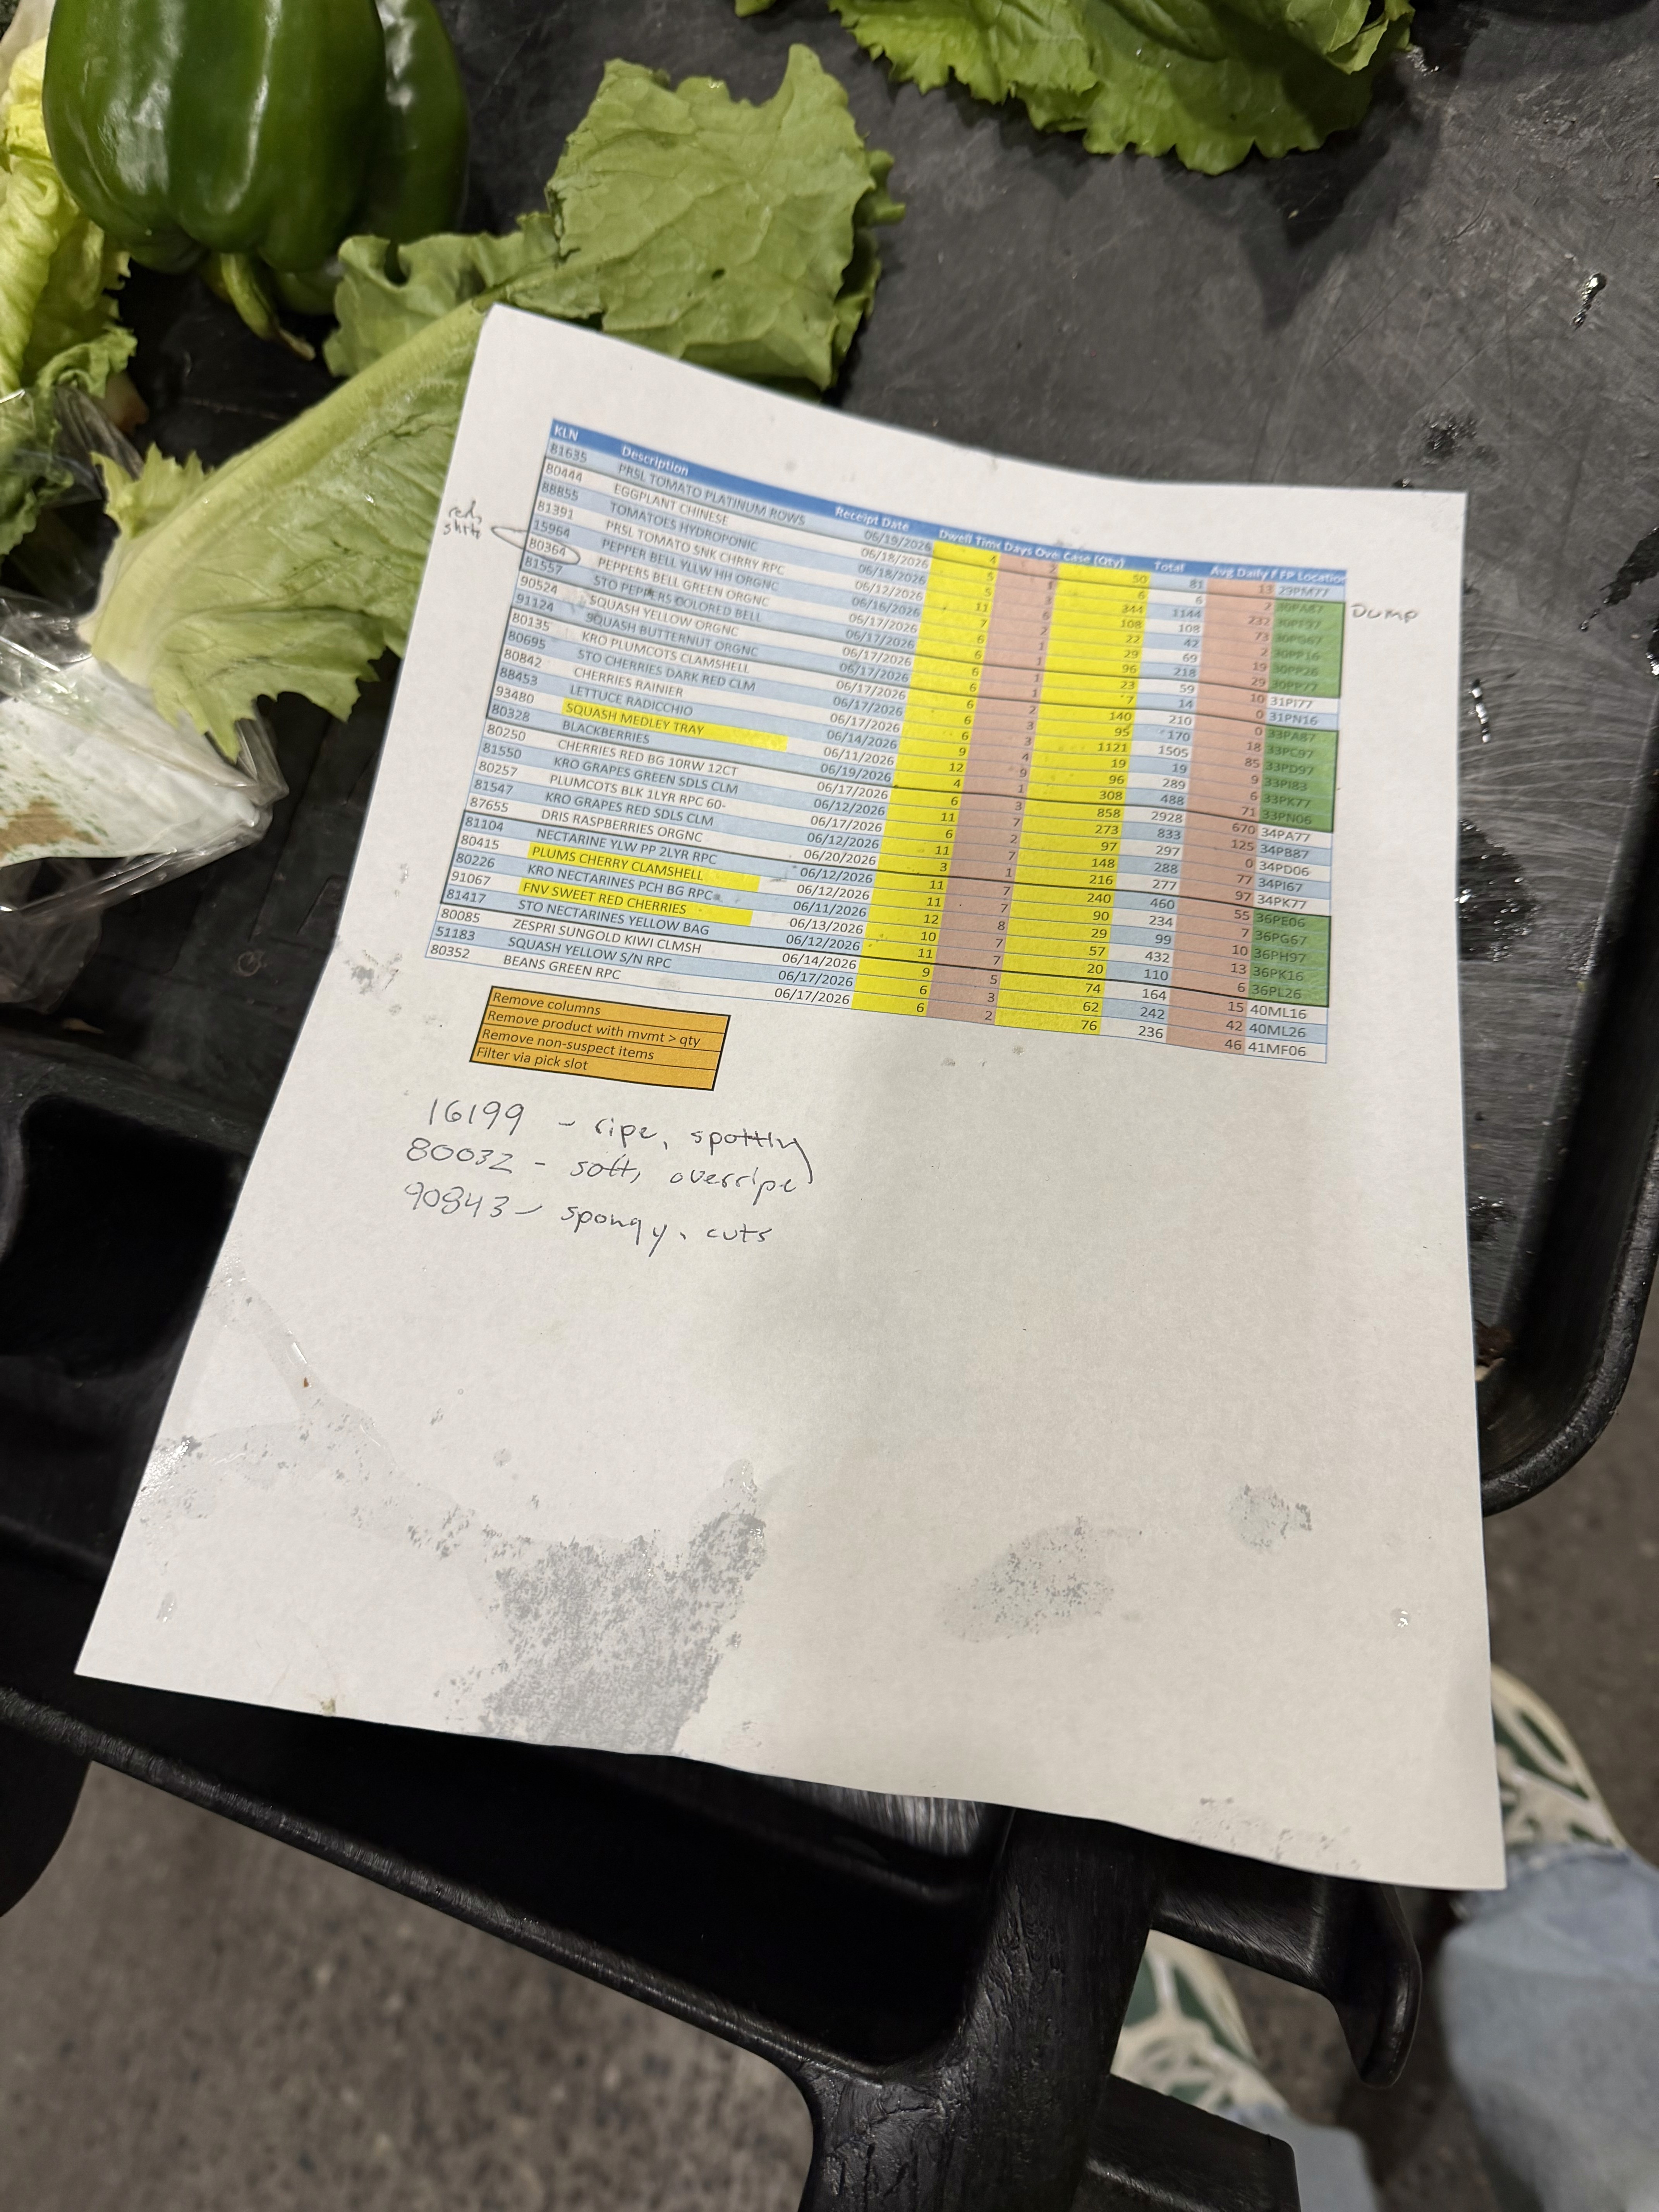
Key Pain Points
Inaccurate reporting
Teams manually hid columns, removed items, and edited reports to create usable lists.
Limited accountability
Teams had little visibility into whether downstream actions were completed.
Visibility to Inventory
Inspectors lacked insight into relevant item location data to inform decision making.
AI SPOTLIGHT
I leveraged Mural and Dovetail AI tools to synthesize notes across surveys, our original stakeholder interviews and 3 DC site visits.
Priority Misalignment
There was a clear disconnect between buyers and inspectors. Although buyers are not our primary user, I was able to interview buyers and was surprised by their response when I brought up Freshness Walks. Research revealed a fundamental disconnect between Buyers and QA Inspectors around ownership of at-risk product.
Buyers viewed their role as primarily reactive: they needed to be notified when product had already gone bad so they could create a claim. They did not see themselves as responsible for deciding what should happen to at-risk product.
QA Inspectors, however, viewed Buyers as the decision makers after a Freshness Walk—responsible for determining what to do with at-risk product, including whether it should be moved out of the DC.
This gap in expectations created ambiguity around who owns the next step once an issue is identified.
We could standardize and streamline how Freshness Walk data is
collected and communicated across DCs. However, we couldn't
control the actions taken bydownstream partners—making
visibility and accountability critical parts of the solution.
Strategic Feature Enhancements

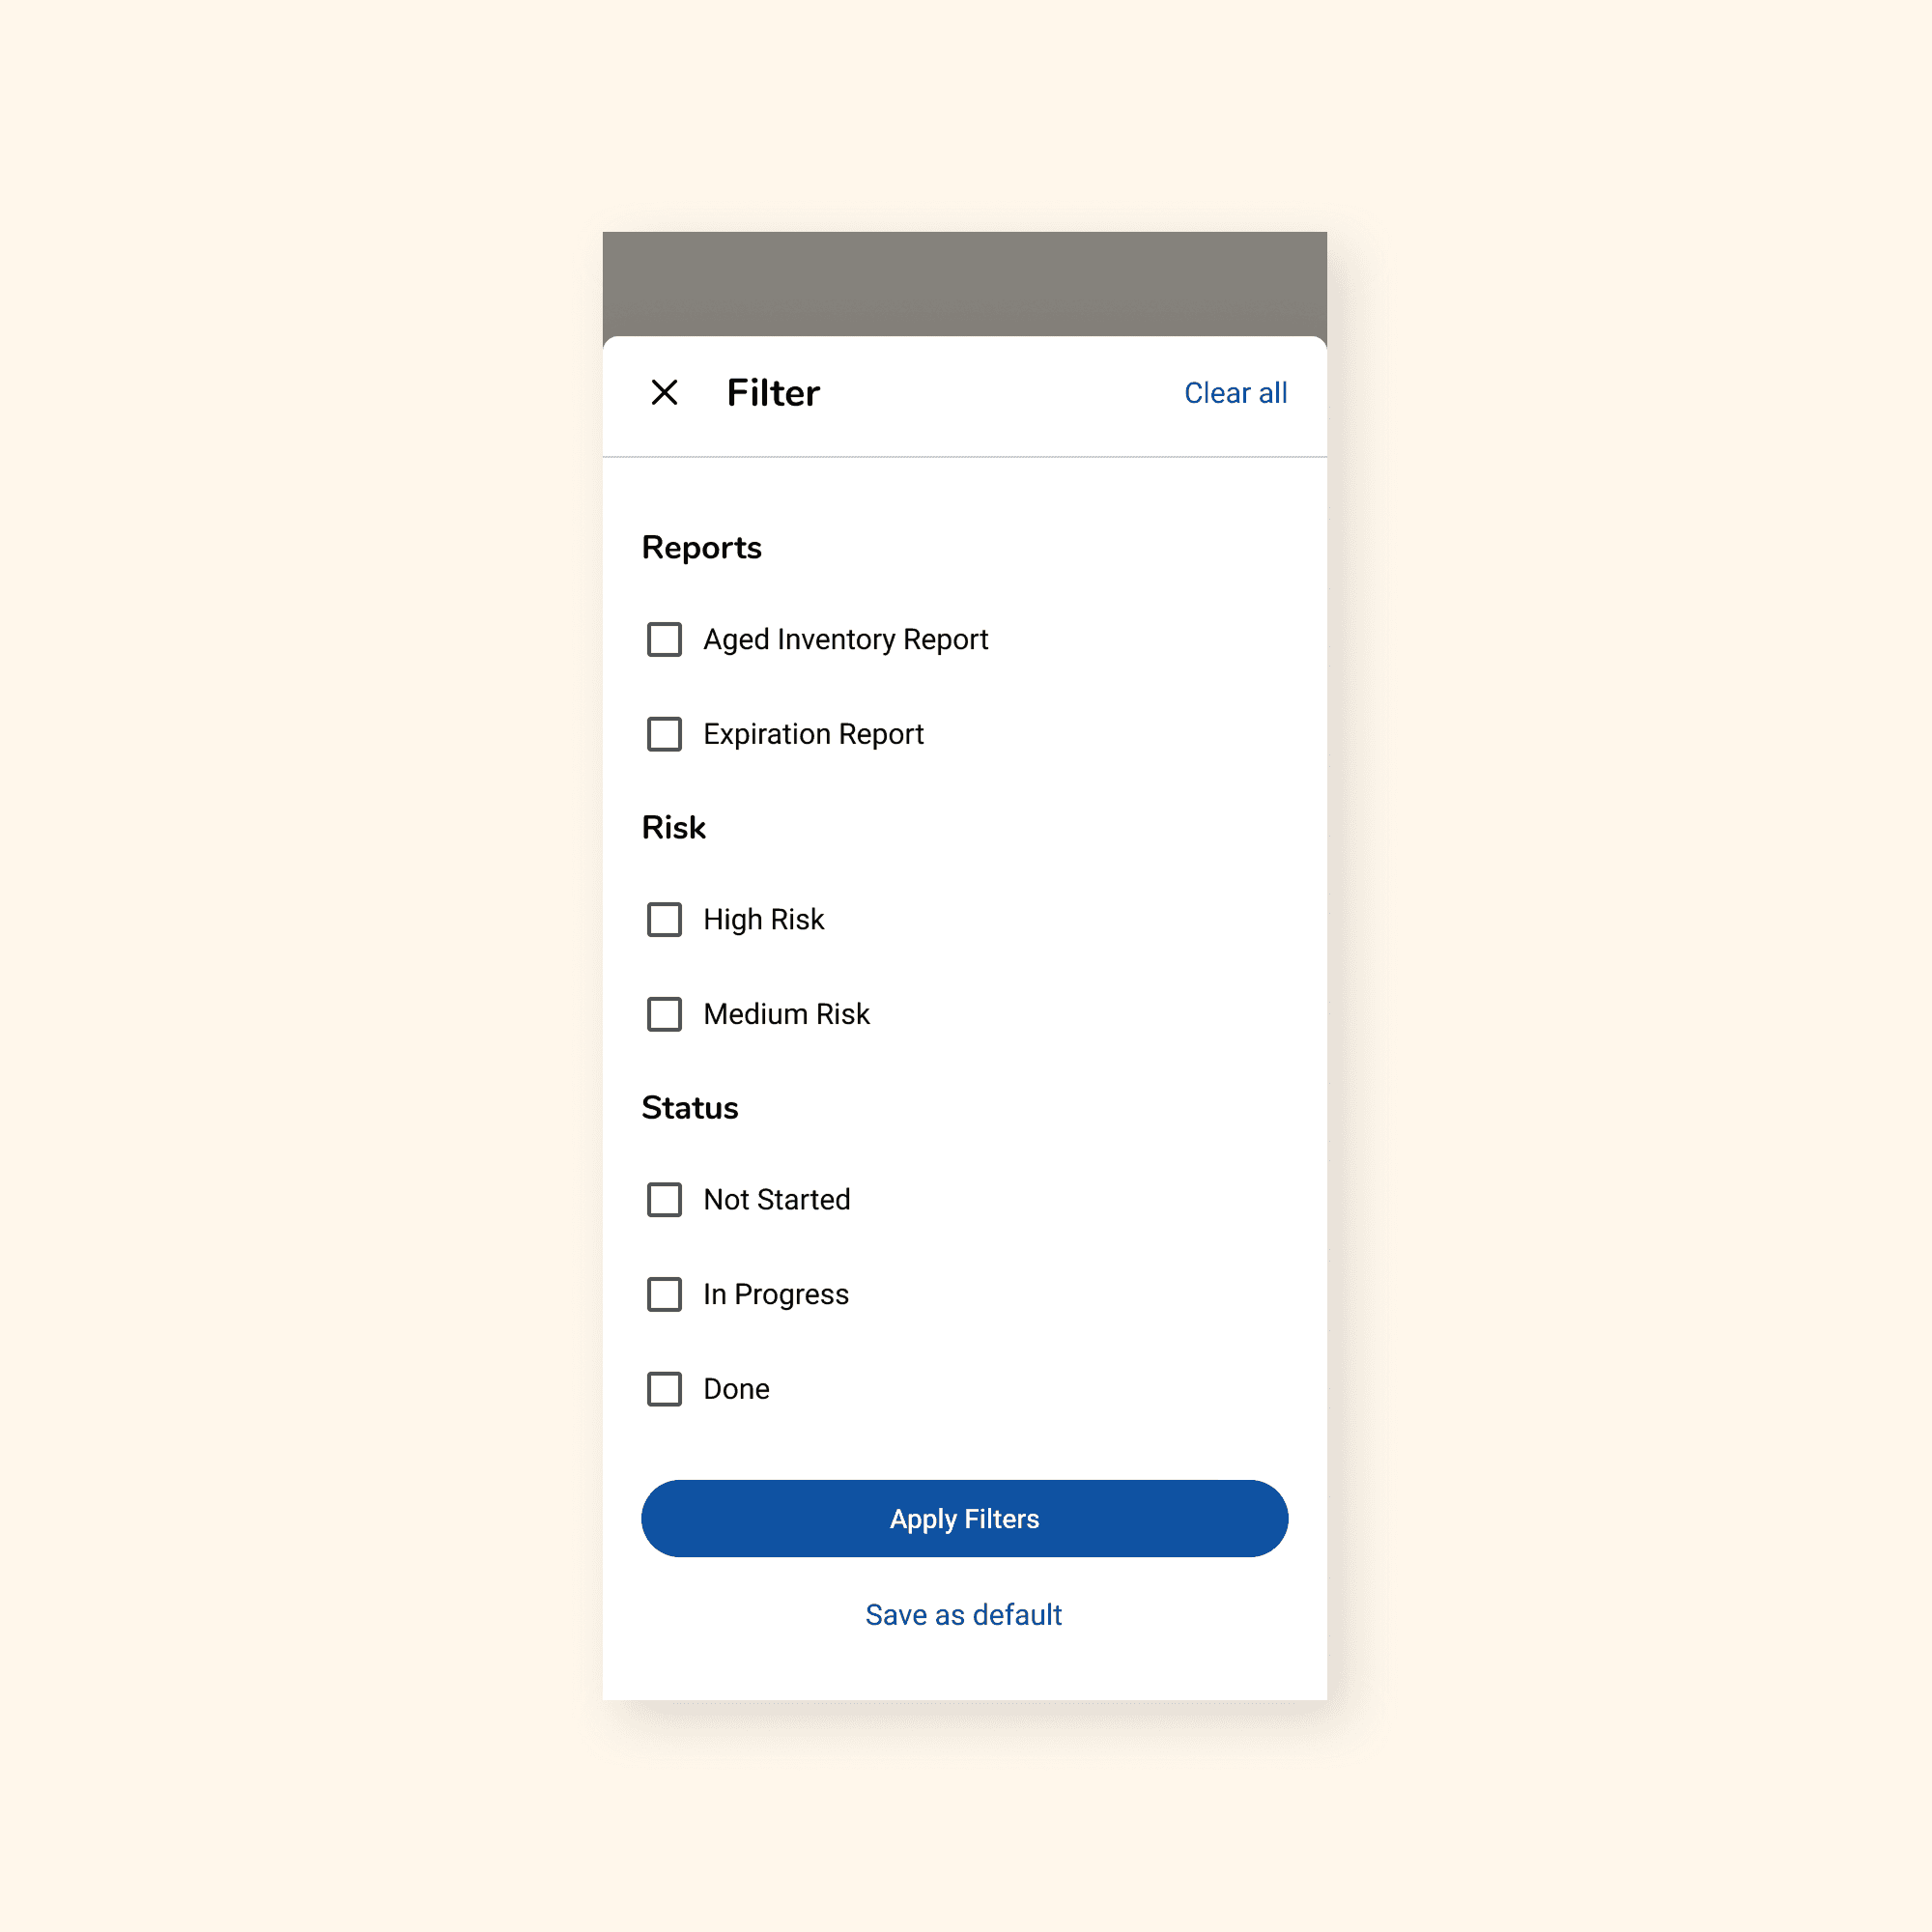
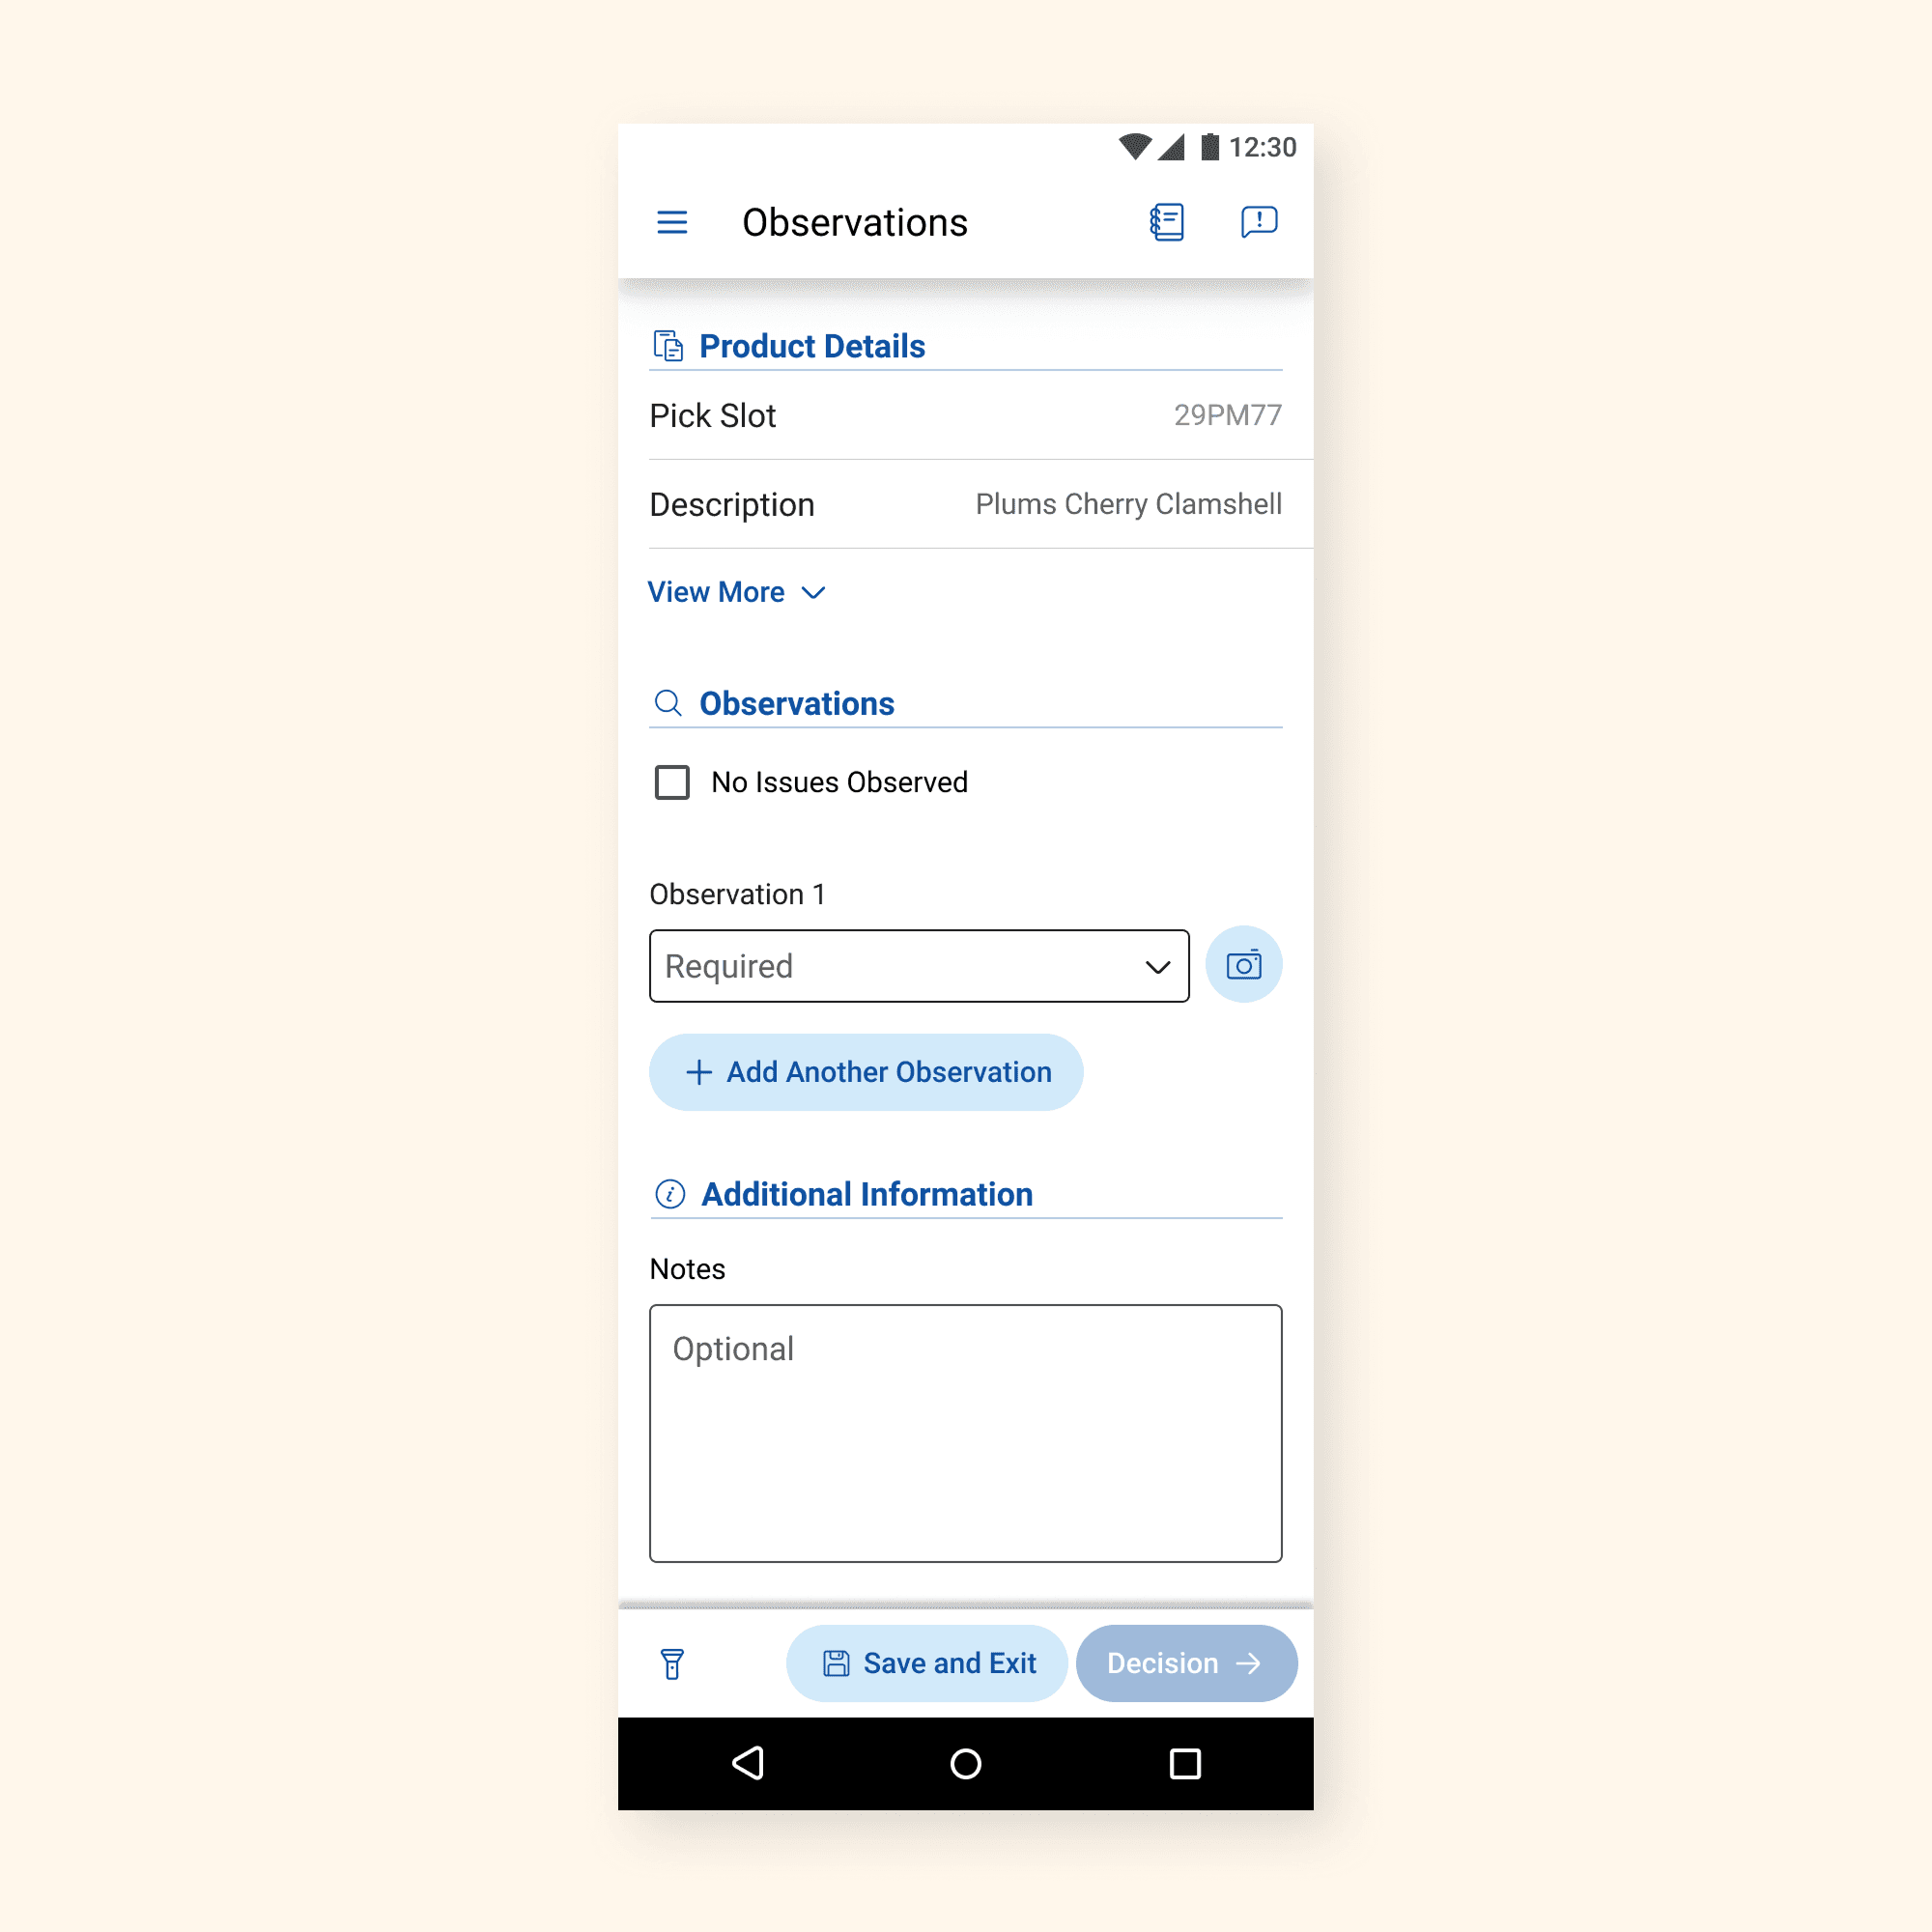
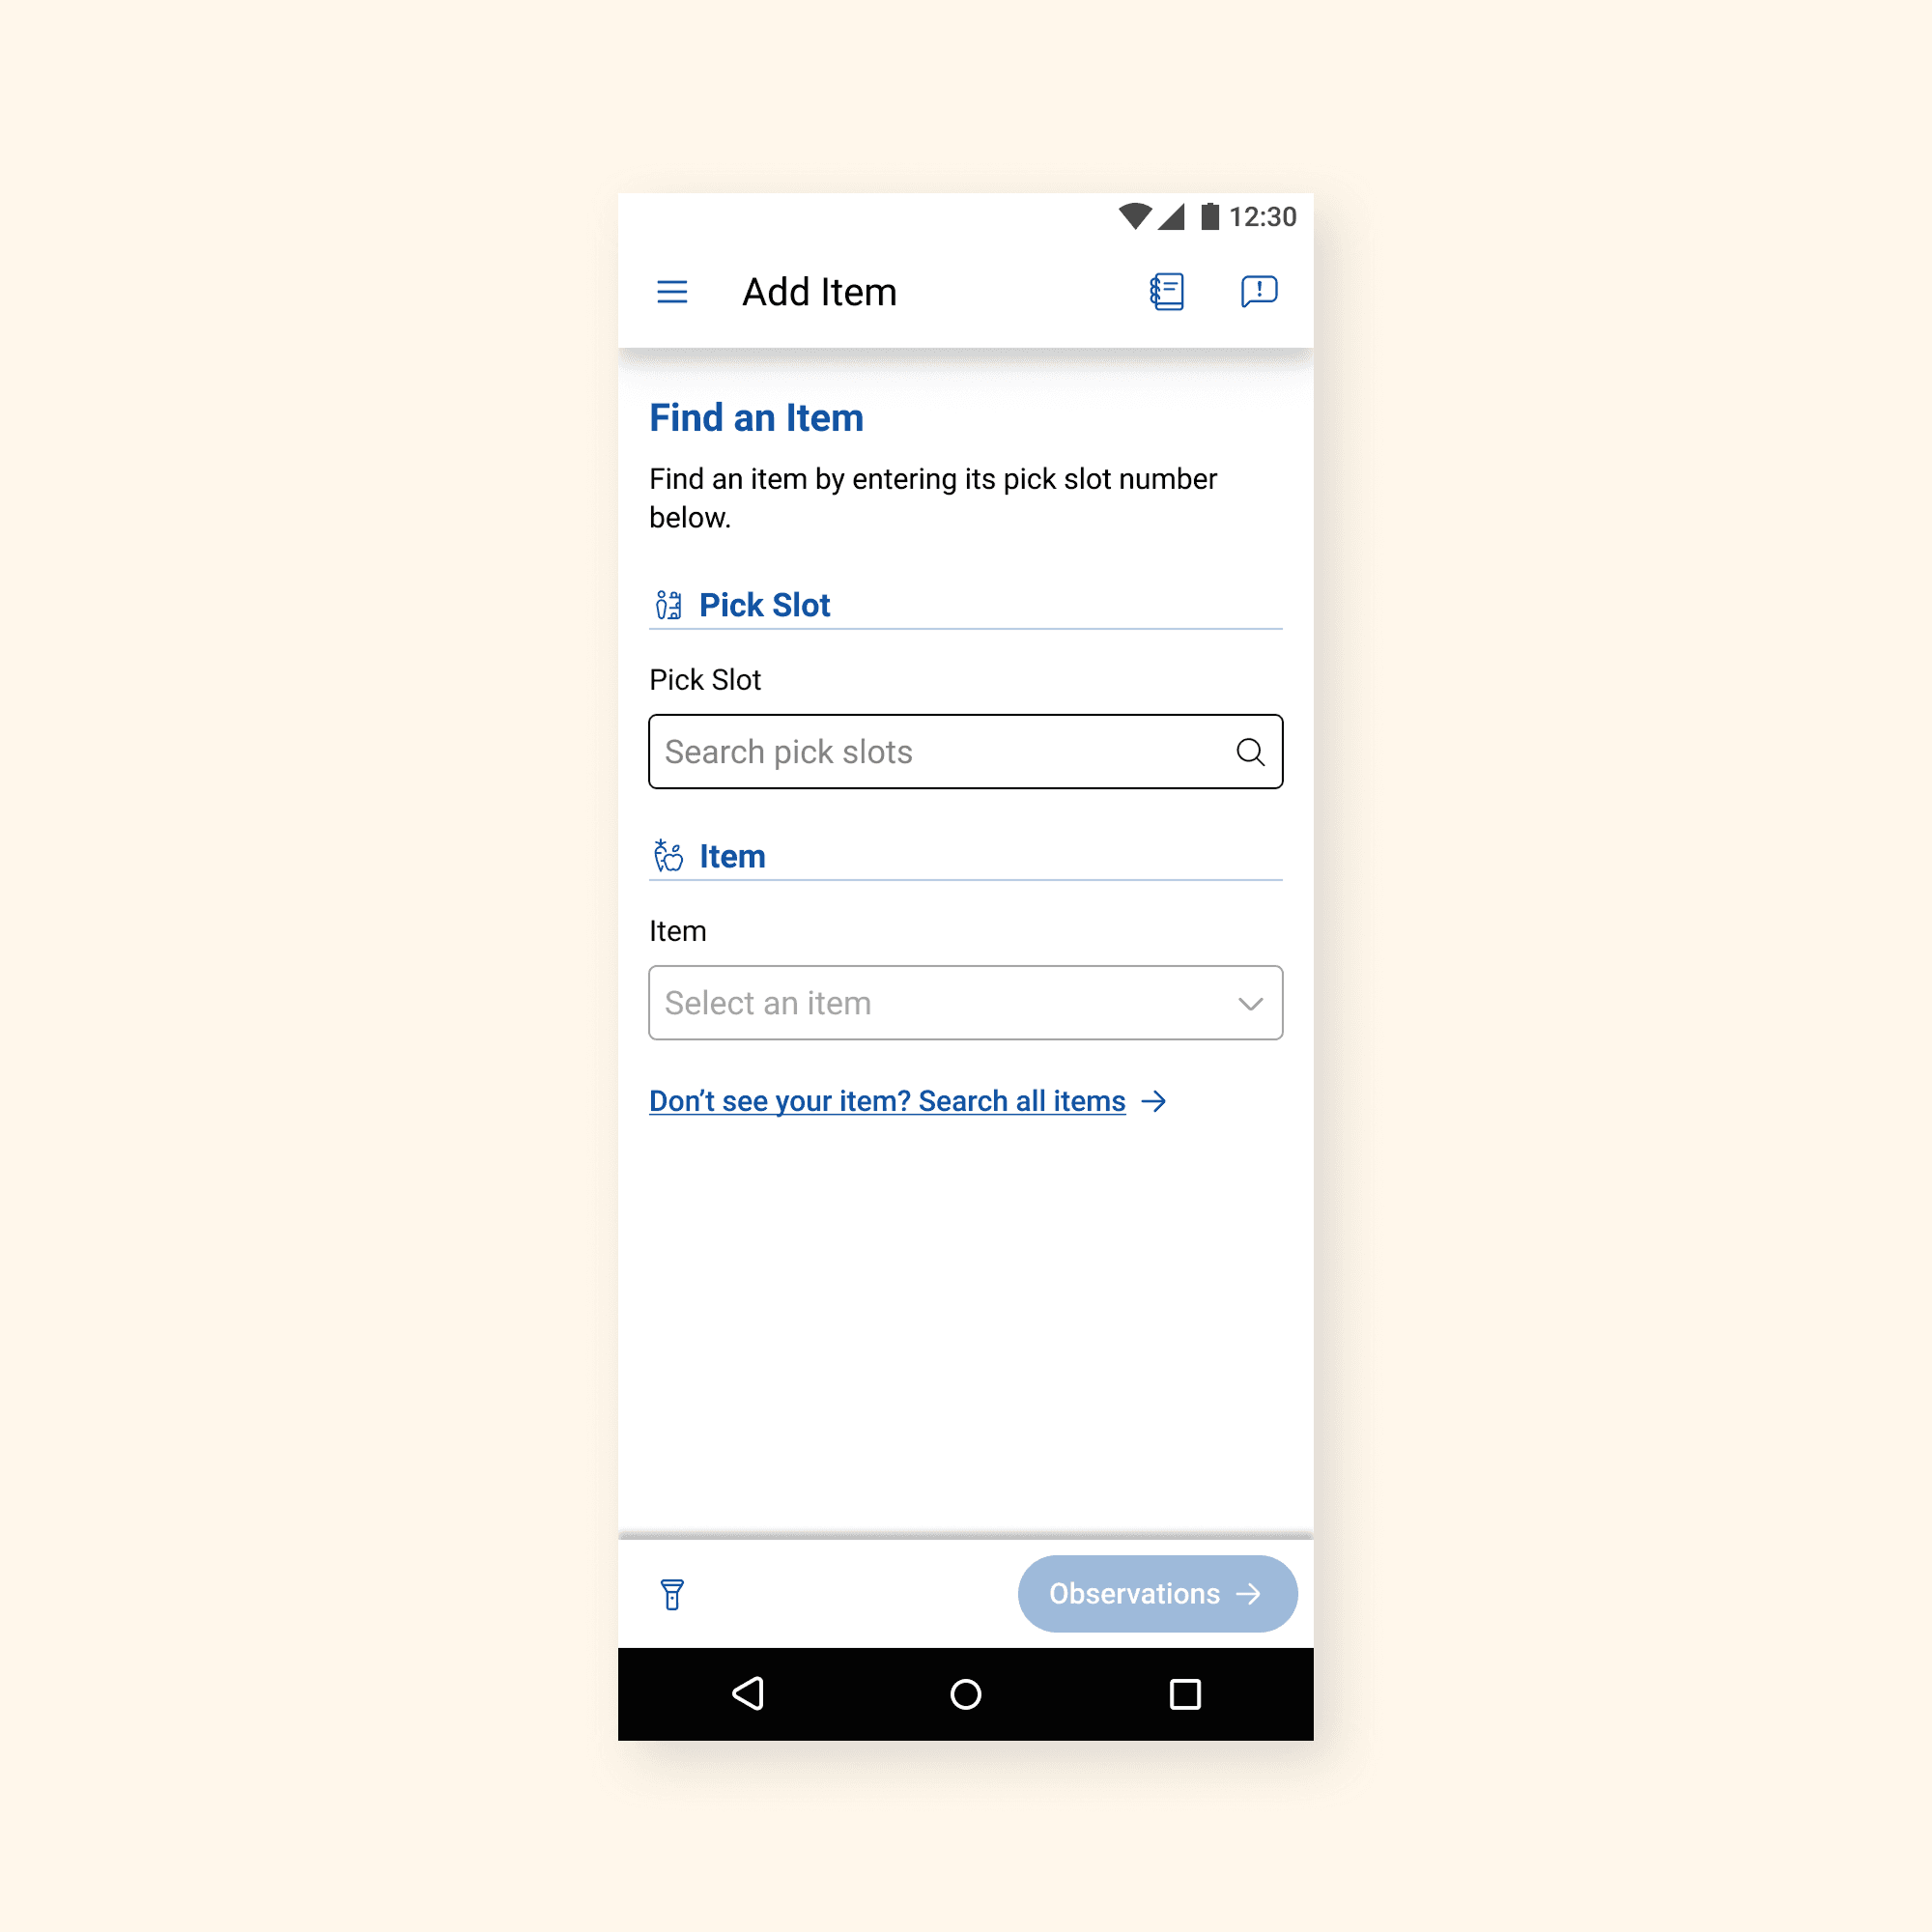
Outcomes
This project is still in progress and yet to be implemented by development. To measure our progress, I am partnering with business stakeholders and product management to define clear measures of success.